A GENUINELY BRITANNIA-WIDE ELECTIONS DAY

Chris Game

I chanced recently upon, in the LocalGov news circular, a local elections preview by Jonathan Werran, CE of the cross-party think tank Localis, which mentioned, in the guise of a rhetorical question, the Birmingham Post

“When the Birmingham Post’s circulation is less than a thousand copies for what is England’s second city, is this sufficient evidence that there is no audience at all for local politics … that this apathy mirrors widespread public indifference for local government accountability and scrutiny, and the sense that local services are something ‘done to’ residents and communities rather than for or with them?”

The remainder of the piece bypassed, rather than refuted, that accusation, en route to vigorously asserting that, even if ministers and civil servants are the key policy shapers, they do their shaping with the knowledge of what happens at the local ballot box.

As a longstanding INLOGOV member with a particular interest in local elections, I wince when politicians or commentators almost dismissively describe any local election year as low-key. It signals that they’ll continue endlessly pontificating about ‘the big one’ in July, November or whenever, while ignoring the thousands of contests and hundreds of local policy issues at stake on May 2nd – AND that this time at least they’re demonstrably wrong.

Which is what I’ve devoted 2,000+ words in, as it happens, this week’s Birmingham Post, to arguing that for us Metropolitan West Midlands electors, every one with two or three separate votes to bestow or withhold – or, indeed, the 150,000-plus full- and part-time staff photo ID-checking in some 40,000 polling stations – next Thursday in actuality is as big as it gets.

OK, I’m guessing a bit about those latter numbers, but the rest holds. This year, almost unprecedentedly (except for the 2021 post-Covid elections), every part of England and Wales[1] has at least one ‘local’ or sub-national, election – local council, mayoral, London Assembly, Police & Crime Commissioners. And, whatever happens in the General Election, the winners will still be there, representing and working for their respective communities, come 2025.

The best illustration of all this is through the Local Government Information Unit (LGIU)’s set of interactive maps – available online, uncontemplatable for the Birmingham Post,but deployable here.

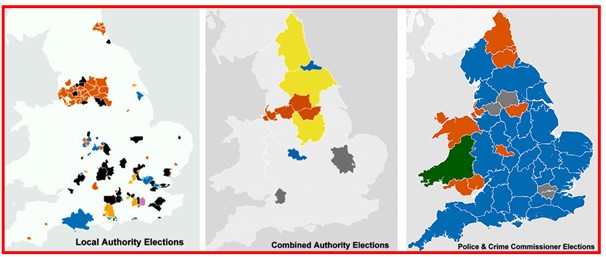
MAP 1 shows LOCAL COUNCIL ELECTIONS, and indeed occupying this year perhaps about an eighth of the England part of the map – as this is a ‘non-county’ year, with no Welsh council elections.

In our still substantially ‘two-tier’ county-district local government system, next Thursday’s elections are for the minority of English district and unitary councils who elect their councillors by thirds or halves, rather than all-out, and for mainly single-tier metropolitan boroughs – smallish in map-area, but with big, concentrated populations, and most of which (Birmingham is an exception) still elect a third of their councillors in three years of each four-year cycle.

Their sizable urban electorates are clustered into small areas of the map, particularly in Yorkshire/Lancashire, and currently are very clustered politically too. Of the three dozen-plus mainly metropolitan councils north of about Cannock Chase with upcoming elections, just one – North East Lincolnshire – is currently Conservative.

The stand-out patch of Conservative blue in the south is Dorset. Established in 2019, its councillors, uniquely and for unexplained reasons, were elected for five-year terms of office, which are replicated this year. There are several blue blobs in our West Midlands metropolitan region – Dudley, Solihull and Walsall – but gone are the days when they can be assumed naturally and nationally to outnumber the Lib Dems’ yellowy-orange. And the black-coloured councils under ‘No Overall Control’ by any single party comfortably outnumber both.

The statistical details of the West Midlands metropolitan contests are summarised in the following abbreviated version of the table included in my Post article.   

The LGIU’s MAP 2 shows COMBINED AUTHORITY (CA) MAYORAL ELECTIONS – those areas created in relatively recent years allowing groups of upper-tier councils to pool responsibility for delivering functions devolved from central government, like transport, economic policy and regeneration, more effectively over a wider area, in our case the West Midlands.

With the formal establishment of the North East CA, there will be 11 of these Combined and Combined County Authorities, our West Midlands CA being one of the longer established, and nine, including us, will be electing or re-electing their Mayors. It is no exaggeration to suggest that, of all the 2,700-plus elections, this West MIdlands one can be considered the single most important – for our city’s future, but also for the future direction and vibrancy of the whole country’s sub-central government.

This LGIU map has just two modest-sized patches of Conservative blue: Tees Valley, whose elected Mayor since 2017 has been Ben Houchen – The Lord Houchen of High Leven to you and me – and the West Midlands led by Andy Street. We know how tight our contest will be – a single Savanta poll managing to put Street both two points ahead of Labour candidate Richard Parker, then three points behind! – and, if both CAs were to swing to Labour, it would surely raise questions for the next Government about the future of this crucial strand of devolution.   

Which brings us to the LGIU’s Map 3 – the POLICE AND CRIME COMMISSIONER ELECTIONS – in England an almost uninterrupted mass of Conservative blue, with patches of Labour red, and, dominating mid-Wales, a substantial block of Plaid Cymru green. Being picky, I’d add a red patch for the Labour Mayor of London, as he (Sadiq Khan) is London’s equivalent of a PCC and both he and the London Assembly should properly be included somewhere on the maps.

It is, of course, these 41 PCC elections, covering all England and Wales, which give May 2nd its indisputably national dimension – and also brought the West Midlands its first election-related headlines. PCCs were created in 2011/12 to make police forces more visibly responsive to local needs. Their core functions are to appoint the chief constable, set the budget, and set local policing priorities, subsequently extended in some cases (like Staffordshire) to the local fire and rescue service.

However, as Mayor Andy Street has long been somewhat enviously aware, his fellow (Labour) Mayors of Greater Manchester (Andy Burnham) and West Yorkshire (Tracy Brabin) had both acquired PCC functions, so why shouldn’t he have a second go at grabbing some of that action.

It’s a challenge – or attempted “hostile takeover” – that, had he acted much earlier and more strategically, could have prompted a useful public cost-benefit debate about the value of having a separate elected PCC role. Certainly, the bid should have been thoroughly researched and publicly tested. But in their partisan eagerness it seems either Mayor Street, or the Home Office on his behalf, screwed up.

West Midlands Police and Crime Commissioner Simon Foster (Lab) was able to claim that the Conservative Home Secretary had a “closed mind” on the issue, and the Judge found that exactly how the change would lead to a more joined-up approach to crime prevention was “left entirely unexplained”. Simon Foster, naturally, is standing for re-election as PCC, but challenged this time by just the single Conservative & Unionist candidate, Tom Byrne, rather than the previous six..

As has been extensively noted, Mayor Street’s campaign generally excludes reference to the Conservative Party, if not from the ballot paper, from his campaign material and social media accounts. His is an individual ‘Brand Andy’ campaign, he explains, and “people are sick and tired of Westminster”.  And, of course, of his party – as he didn’t add.

I’ve not seen the point made explicitly, but ‘Brand Andy’ could apply even more strikingly to our Mayor’s evidently genuinely warm and productive working relationship with Greater Manchester Mayor, Andy Burnham, notably over a post-HS2 “alternative connectivity plan”, and on Street’s part a reluctance to rule out voting for Burnham, were he a Manchester resident.

A big and possibly electorally crucial difference, however, is that recorded in a recent Centre for Cities opinion poll – that, while over a third of Manchester respondents could name at least one of Mayor Burnham’s policies, barely 10% of West Midlanders could recall one of Street’s, despite the fact that he certainly has plenty – plus, apparently, cash. It’s a disappointing stat for someone who sculpts his reputation on getting things done.

_________________

.


[1]  Which, with the exclusion of Scotland, which the Romans never properly occupied, represents what the Romans called Britannia – hence the title.

Democratising public administration through public-common partnerships: the case of the Citizen Assets Programme in Barcelona

Marina Pera and Sonia Bussu

In a recent article titled Towards Democratisation of Public Administration:Public-Commons Partnerships in Barcelona, part of a Special issue on The International Journal of the Commons (edited by Dr Hendrik Wagenaar and Dr Koen Bartels), we explored public-commons partnerships in Barcelona through a relational lens, examining how they might be contributing to deeper democratisation of public administration.

The commons refer to those cultural and material resources collectively managed by the community and represent an alternative to both the state and the market. Recent literature emphasises the capacity of the commons’ prefigurative politics to develop alternative institutions to neoliberal regimes and/or deliberative and collective forms of resource management. The grassroots movements managing the commons often take an oppositional stance to the state, but they might also depend on its resources. By the same token, the state has an interest in supporting assets and services managed as commons, which offer flexibility and efficiency, while encouraging citizen participation in local politics.  

Within political contexts sympathetic to progressive socio-economic projects, such as  new municipalism in Barcelona, formalised alliances between the local state and the commons started to emerge, facilitating the development of novel policy instruments that respond better to the demands of the commons and open opportunities for more participatory policymaking. So-called public-common partnerships are long-term agreements based on cooperation between state actors and the commons members. In our paper, we wanted to understand better the relational work behind these partnerships and the role of boundary spanners that build bridges between two worlds, such as the state and the commons, which are often quite distant in terms of visions of local democracy and the language to articulate such visions.  We take the case of the Citizen Asset Programme (CAP) in Barcelona to explore the relationships between public officials and commons members, highlighting how these collaborations shape governance practices and can help foster a collaborative culture within public administration.

CAP was approved in 2016 and aims to create the institutional framework to recognise and support commons-managed municipal assets in the city. Based on qualitative analysis of interviews with public officials and commons members involved in the partnership, as well as official documents, we drew out insights on the relational dynamics that facilitated the creation of two policy instruments under CAP: The Community Balance Metrics and the Social Return on Investment of Can Batlló. The first one is a set of indicators to evaluate the performance of community-managed assets considering their transformative potential and including dimensions of internal democracy, care, inclusion, and environmental sustainability. The second helps to measure the value of activities and volunteer work carried out in the community centre of Can Batlló.

Through a series of vignettes depicting the different state and commons actors involved, we examined how they forged alliances and employed creative thinking to manage conflicts, resistance, and scepticism from both the local administration and the grassroots movements. Public officials from the Active Democracy Department were able to build trust among commons representatives by recognising their needs and potential. They explained the workings of public administration in a clear language. They created spaces of open-ended dialogue between grassroots movements and different departments to facilitate the development of policy instruments, measures and indicators that valued the commons’ innovative work, while still coherent with existing legal requirements. For instance, a working commission was set up involving members of Can Batlló, the Legal and the Heritage Department, as well as representatives of the District administration. This public-commons partnership developed a comprehensive agreement to regulate asset transfers, which fully recognises the social and economic value of the commons.

By the same token, the commons members played a crucial role in communicating to grassroots movements the work of the Active Democracy officials and build mutual trust. On the one hand, they helped the commons understand feasibility issues of their demands; on the other they pressed the public administration for greater transparency and creative interpretation of existing regulatory framework to strengthen democratic values underpinning asset transfer agreements.

Two cooperatives supported these partnerships as consultants. They contributed knowledge of innovative public policies from across the world. They also facilitated knowledge sharing to encourage cooperation between commons members and state institutions, for instance by inviting grassroots groups from other parts of the world to share their experience of working with the state.

The work of these public-commons partnerships is gradually reshaping the administrative culture and fostering more transparent and democratic working practices within the public administration. An example is the joint work to develop the Community Balance Metrics, which helps evaluate the performance of the commons using indicators agreed upon by both local public administration and the commons. However, these processes face a number of challenges, as they clash with established working routines and performance evaluations of public administrators that hardly ever value participatory work. Existing literature suggests that despite the introduction and encouragement of new practices, there is a tendency to revert to traditional policymaking methods when faced with unexpected problems. When boundary spanners that had supported the partnership exit the process, they can leave a vacuum that is hard to fill and that can jeopardise the partnership. In Barcelona, ongoing discussion between Can Batlló members and the City Council on who is responsible for funding the refurbishment of one of Can Batlló’s building is causing friction within the partnership and some of the work has stalled.

Inevitably this collaborative work is hard to sustain, but in the face of multiple and overlapping crises facing local government, these public-commons partnerships are also beginning to open safe space to experiment and do things differently.

Picture credit: Victoria Sánchez.

Sonia is an Associate Professor in INLOGOV. Her main research interests are participatory governance and democratic innovations, and creative and arts-based methods for research and public engagement. She led on projects on youth participation to influence mental health policy and services, coproduction of research on health and social care integration, models of local governance, and leadership styles within collaborative governance.

Marina is a researcher at Autonomous University of Barcelona (UAB). She holds a PhD in Public Policy from UAB and a M.A. in Sociology from Columbia University (New York). She has been a visiting scholar at CUNY Graduate Center (New York) and at INLOGOV, University of Birmingham. Her research interests
include community assets transfer, democratisation of public administration, community development and public-common partnerships.

Europe’s Largest Local Authority – It’s NUTS!

Chris Game

It’s little consolation to the ‘powers that were’ in Birmingham Council House, but the past several months’ headlines about “Europe’s Largest Local Authority” going bankrupt have done wonders for my personal online social networking. From the BBC and Financial Times to the World Socialist International Trotskyists, that headline has made us Brummies suddenly globally famous as citizens of ELLA.

I’ve been emailed by erstwhile colleagues and ex-students I’ve not seen or heard from for years, now back home in Australia and South Africa, Japan and Kazakhstan, wanting to know whether Birmingham really is Europe’s Largest Local Authority – like it boasts on its Website Awards page – and, if so, why didn’t I make more of it while they were students here.

Yes, they’re curious about the bankruptcy bit, which I also have to try to explain, but it’s the ELLA boast that really fascinates them – because they recall their travels around Britain and Europe, and clearly blame me for their not having been able to boast about temporarily residing in the continent’s LLA.  The clever-dick ones even add, “What about Kent?” Or “Didn’t you say it was East Lindsey in Lincolnshire?”.

And they’re not wrong, of course. Take the real ‘biggies’.  In population, Kent is nowadays just one of the ‘Big 3’ of the 36 non-metropolitan or shire counties – its 1,858,000 fractionally behind Essex and Hampshire, and all roughly half as large again as Birmingham City Council’s 1.15 million. However, those counties’ local governments are, of course, two-tiered – counties and districts, each responsible for different functions and services. And – spoiler alert – it’s single-tier or unitary authorities, responsible for providing all principal local government services in an area, that count here. 

County councils provide services covering the whole county – education, adult social care, waste disposal, etc.  More local services, like refuse collection, environmental health, and leisure facilities, are provided – as I’d certainly have pointed out – by, in Kent’s case, 12 smaller district councils.

Sounds straightforward, doesn’t it?  In fact, it’s anything but, and, if you were a class of students, I’d have had to at least mention the bizarre distinctions between ceremonial and historic counties, Lord-lieutenants (Lords-Lieutenant?) and High Sheriffs. Suffice it here to stress that it’s the two-tier structure and the ‘county’ bit that bar these bodies from challenging Birmingham’s status as ‘Largest’.

We do, of course, have a West Midlands Combined Authority, headed currently by Mayor Andy Street, but that’s entirely different and its 18 local authorities cover a far larger regional area than the old West Midlands County Council that Margaret Thatcher abolished in 1986. It’s an increasingly important, and influential, regional and national voice, but definitely not a local authority.

And East Lindsey? I honestly can’t remember ever mentioning this.  If I did, I’d guess it was to encourage some overseas students to visit Skegness, as somewhere ‘different’ but inherently English and off the proverbial tourist track. It’s a pleasant seaside resort with a rather splendid clock tower – which tells the time, unlike, for apparently a further several weeks, the UoB’s Old Joe – that probably happened then to be the largest town in England’s geographically largest local government district – East Lindsey – and five or six times the area of Birmingham.

We’ve fully established, then, that Birmingham’s ‘Europe’s Largest Local Authority’ claim has nothing to do with either population or geographical size, but everything to do with the UK’s uniquely large-scale, or ‘non-local’, local government structure and the gradual disappearance of devolution to more local units of government.

Put another way, it’s a question of NUTS. Yes, there’s plenty about our local government system that doesn’t make much sense – not least its sheer non-localness – but here we’re actually talking about the Nomenclature of Territorial Units for Statistics, which both sounds better in the original French and produces an easily memorable acronym.  

It’s statistical shorthand for the EU’s hierarchical way of standardising the different ways in which the hugely varying EU states administratively structure their sub-central governments – regardless, if necessary, of the institutional reality. A statistical harmonisation exercise, therefore, rather than an aid to serious cross-national local government comparison.

The NUTS classification subdivides every member country into three principal levels, NUTS 1 to 3, to which large countries can add further levels by subdividing NUTS 3 into LAU (Local Administrative Units). Very roughly, then, the currently 92 NUTS 1s are major socio-economic regions or groups of regions of relatively larger states – Germany’s 16 Länder, France’s 14 Régions, Poland’s 7 Makroregiony. And the UK, were we still EU members, would have 12: West Midlands and the eight other English regions, plus Scotland, Wales and Northern Ireland.

The 240 NUTS 2s are basic regions or regional groupings for the application of regional policies – Austrian Bundesländer, Belgian, Dutch and France’s former Provinces – and in the UK 40 conveniently grouped counties, London ‘districts’, and in the West Midlands its seven boroughs.

The 1,164 NUTS 3s tend to be sub-divisions of regions, provinces, counties, or groupings of municipalities for specific purposes, rather than individual local authorities. But such is the UK’s exceptional non-local scale that it takes nearly one-sixth of that total (174), with many councils qualifying for their own, including all seven West Midlands boroughs.

Even forgetting the UK’s large slice, that 1,164 doesn’t sound that many for a whole continent, does it?  Hence those Local Administrative Units – over 92,000 of them which constitute the overwhelmingly biggest columns in the main NUTS table. In our case LAU 4s would be the upper tiers of our traditionally two-tier system of county and district councils, and LAU 5s the lower tiers – or, rather, would have been, the two levels having since been merged.

I hate that LAU term. It’s misleading bureaucratese: a seriously disparaging label for what most European countries’ residents would first think of when asked to identify their elected local governments. To pick some examples: France’s LAU 4s were/are its nearly 35,000 Communes, Germany’s its 10,775 Gemeinden, Italy and Spain their 8,000 Comuni and Municipios – with, obviously, what we would consider mostly modest-sized populations to match.

At which point I admit my age and recall Mr Spock’s immortal response to Star Trek’s Captain Kirk: “It’s life, Jim, but not as we know it”. And yes, I know it was from a later song, rather than the TV series, but it fits. Because for a Brit those sizeable NUTS/LAU numbers could easily be described as representing “Real Local Government, Jim, but not as we know it.”

Chris Game is an INLOGOV Associate, and Visiting Professor at Kwansei Gakuin University, Osaka, Japan.  He is joint-author (with Professor David Wilson) of the successive editions of Local Government in the United Kingdom, and a regular columnist for The Birmingham Post.

Photo credit: Mac McCreery https://www.flickr.com/photos/simac/

Does Parliament discuss Local Government issues?

Steve Watson

So far in 2024 (as at 19th March), there have been 26 debates in Parliament to discuss Local Government issues. By way of comparison, there have been 12 debates on illegal immigration, and 16 on energy prices.

So, it seems reasonable to conclude that Parliament does discuss Local Government issues, but what issues have been discussed and who’s been doing the talking?

There are various sources of data on this topic, including Hansard and Parliament TV.  For this blog, I used the ScrutinyCounts app, which analyses MP’s contributions in Parliament (as recorded by Commons Hansard) and presents the data in an easy-to-use format on a mobile app so users can see who is saying what about which topics quickly and easily on their smartphone. 

The charts below, taken from the Scrutiny Counts mobile app, show the Local Government debates that have taken place so far this year and the date they took place.

As can be seen from the screenshot charts, there’s a breadth of discussion on Local Government matters ranging from Financial Distress and Funding, Combined Authorities, Mayors, through to Four-day week working. Within the app, there is click-thru functionality which lets you see the full debate content, the MP’s who have participated, and the contributions they have made. There’s also “share” functionality to enable useful and interesting content to be quickly and easily shared with friends and colleagues.

Looking across the past twelve months, there have been over 159,000 words spoken in Local Government debates (measured by words spoken as recorded in Commons Hansard).

Across the debates, Conservative MPs contributed into the debates 66.5%, Labour 22.4% and other parties 11.2% (this compares with the party split by number of sitting MPs of 53%, 30% and 17% respectively).

As can be seen in the “monthly breakdown” area of the chart below, after a relatively quiet few months over summer of 2023, the level of debate activity significantly increased during Autumn 23 and early 2024 with February 2024 being a particularly busy month.

Perhaps not unsurprisingly the top contributing MPs in Local Government debates were government and shadow government ministers such as Simon Hoare (Parliamentary Under Secretary of State (Department for Levelling Up, Housing and Communities) and Jim McMahon (Shadow Minister (Levelling Up, Housing, Communities and Local Government) with contributions being made in their respective roles.

But aside from Frontbench MP’s, who have been the top contributing Backbench MPs in Local Government related debates during the last 12 months? (measured by words spoken as recorded by Commons Hansard).

The charts below show the top contributing Frontbench MPs, and the top contributing Backbench Conservative and Labour MP’s;

There are often detailed and constructive contributions into the debates from all the parties. The quotes shown below are taken from speeches given by the two top contributors in the above charts. They both give an insight into the work that MPs do in representing their communities and constituents in parliamentary debates.

So, in summary, yes Local Government issues are discussed in Parliament. The news in the mainstream media may focus on the weekly exchanges in PMQ’s, the political gossip of the day, or the topical late night divisions and votes, but in so doing many don’t see the work MP’s of all parties do in important debates across a range of subjects such as Local Government, Housing, Social Care, etc.

The contributions in debates are often constructive and well thought through, providing valuable insight for politicians, councillors, and council officers and all those with an interest in Local Government. The debates form an important function in bringing local issues to the national stage and play an important role in our democratic system.

The charts and images in the article are taken from the ScrutinyCounts mobile app which is available via subscription on Apple AppStore and Google Playstore. The app uses data as reported in Commons Hansard and presents it in an easy to digest format which enables users to quickly and easily read what MPs are discussing in Parliament.

Steve Watson is a Director of Hinc Ltd, the provider of the ScrutinyCounts mobile app. Steve started his career as an electronics engineer but quickly came to realise he was more suited to working with computers rather than designing them! After being a joint owner of a Local Authority data insight company which was successfully grew and subsequently sold, Steve started a new venture to develop a mobile app called ScrutinyCounts which enables users to quickly and easily see what is being said, and by who, in Parliament.   More information about ScrutinyCounts can be found here or at Twitter/X @ScrutinyCounts 

The UK’s Flipping Gender Gap

Chris Game

As I’ve aged, I’ve become ever keener to find mnemonic tricks that might help my increasingly faulty memory to recall potentially useful stuff – like, this week, key dates in the history of women’s suffrage. At some point somewhere during the extended celebrations of International Women’s Day (IWD) beyond March 8th, for example, there’s almost bound to be some reference to women gaining (or, in Afghanistan, losing/regaining?) the right to vote.

I used to lecture about this historic stuff and my women’s suffrage mnemonic was/is 1869, the year at least a few women – unmarried ratepayers in GB & Ireland – gained the right to vote in local elections.  Which, while obviously not globally record-breaking, sounds tolerably progressive – until you deploy the mnemonic, reverse the central digits, and recall that women in the Dutch province of Friesland had been at it for nearly two centuries – or since 1689, to be precise.

This IWD contribution, unsurprisingly, is not about women gaining the vote, but how, in post-war Britain they’ve collectively been exercising it in successive General Elections. And it’s aided by the following striking graph, whose ‘gender gap’ approach was developed by Inglehart and Norris back in 2000. They and their successors duly updated it in successive elections, drawing comparisons/contrasts with other countries, but only in the past few years has it really come into its own, and for the obvious reason: that it’s so visually, and politically, striking – as the version prepared for me by the Birmingham Posts editorial team demonstrates.

All but one of the first 19 bars/columns are blue, showing women as more likely to have voted Conservative by varying percentages up to a mighty 17% in the early 1950s. The sole exception was 2010, the first of the recent run of ‘hung Parliament’ elections, when men and women were equally likely to have voted Conservative, so no column at all.

It had become a truism: that, certainly in Britain, women were at least marginally more Conservative or right-wing than men in their voting behaviour. Until suddenly, in both the 2017 and 2019 General Elections, they weren’t – in each case being a sizeable 12% LESS likely to have voted Conservative than men.

Some unknowable proportion of what was swiftly tagged our Flipping Gender Gap was undoubtedly attributable to women’s consistently greater enthusiasm for remaining in the EU, but those striking 2019 gender gap figures are still worth detailing. Conservative: 47% of men, 42% of women; Labour: 29% of men, 37% of women – representing a massive 18% Conservative lead over Labour amongst men, and just a 5% lead amongst women.

Which begs the obvious question of whether we’ll see something comparable this time, and, if so, to what degree? Or was it, say, Brexit in those two elections that produced a kind of two-off aberration? Either way, these ‘gender gap’ statistics will be among the most anticipated and intensively studied, as commentators prepare their voting forecasts.

Indeed, they already have been, the commonest immediate reaction from those who study these things, particularly following the 2019 election, being that “at last” UK women voters were catching up.

For the stats have shown that for years now many/most other established democracies – the US outstandingly, but also the Scandinavians, Netherlands, Germany, Austria, Canada, even Italy – had seen the development of a modern-day gender gap, with women more likely to vote for left-leaning parties than men, while our gender gap showed the reverse.

No longer, then, did the UK seem to be bucking the global trend. As in these other democracies, as more women entered higher education and paid work, some at least became more socially and economically liberal and supportive of gender equality, pushing them to the left of men in their party choices.

Even just typing that ‘UK women voters’ label, though, I’m conscious of risking over-simplification. And indeed, it obscures significant and unsurprising differences across age cohorts. Younger women are considerably more likely to support Labour and less likely to support the Conservatives than younger men, but this modern gender gap lessens and eventually disappears among older voters.

So how will all this affect what happens in this year’s General Election? The estimable UK Women’s Budget Group commissioned a YouGov poll last autumn which reflected and updated some of the above findings – starting with almost a law of UK electoral politics: women take their time to decide.

Asked for their voting intentions, 18% of respondents hadn’t, with no election in the immediate offing, made up their minds: 11% of men and a full 25% of women. Those that had decided split very similarly between the major parties: Men – 20% Conservative, 31% Labour, 7% Lib Dem; Women – 17%, 31%, 8%.

The big difference came with the then Don’t Knows: just 11% of the men, but one in every four women. So, if they hadn’t then decided, perhaps they won’t vote?  By no means: 13% of males were ‘would not voters’, and just 3% of females.

Probably not surprisingly, their policy priorities differ somewhat too. NHS and healthcare is highest ranked by all, but that was 48% of men and 64% of women. The economy was “most important” for 44% of men, but only 28% of women, and the reverse was the case for ‘Environment and climate change’ and ‘Education and schools’ – the latter ranked “most important” by 18% of women but just 9% of men.

And, to quote the ever-flexible Forrest Gump: that’s all I have to say about that – for the time being.

Chris Game is an INLOGOV Associate, and Visiting Professor at Kwansei Gakuin University, Osaka, Japan.  He is joint-author (with Professor David Wilson) of the successive editions of Local Government in the United Kingdom, and a regular columnist for The Birmingham Post.

Inflation and Local Authority Budgets

Andrew Coulson

Our two main political parties are locked in a strange debate about the next budget, on 6 March. The elephant in the room is the underfunding of local government.

In the nearly 14 years of Conservative government, the core spending power of local authorities has been cut by 27% in real terms.[1] The County Councils Network has “warned that its members are under extreme pressure, and that the authorities they represent are set to overspend by almost £650m this year due to spiralling costs, particularly in children’s social care and home to school transport, which was contributing to a £4b funding deficit for those authorities over the next three years”. In addition an increase in the National Living Wage is expected to costs these councils £230m next year.[2] This has happened at a time when the ability of councils to raise their council taxes has been held down, for 2024-5 to below 5% for all but a tiny number of councils.[3]  One of its consequences has been the inability of the employers in local government and the NHS to negotiate pay settlements which reflect the rate of inflation, or anything near it.

My reading of the present position is that Gove on the one hand and Rachel Reeves on the other are playing chicken. Each are waiting for the other to move first. They both know that after the general election a new government will have to settle the long-standing pay disputes in the public sector, and that it is not possible, year after year, for the pay of staff employed by local government and the NHS to rise by less the rate of inflation. The consequences are visable: depressed morale, a haemorrhage of experienced staff, and dependence on immigration to employ new staff. Rachel hopes that the Conservatives will be forced to confront this before the election. Gove wants the Labour Party to commit to doing it, because as of now any settlement is unfunded.

My view is that the understanding of inflation both by the two main political parties and the Bank of England is naive, especially as it relates to government policy. The starting point should be that inflation affects the distribution of income. It is an intrinsically political process. Most large companies and the richest people have means through which they can compensate for any inflation. Those who do not have the power or muscle to do so pay the price. Thomas Piketty[4] showed that inflation was the main means by which the middle classes paid for much of the costs of two world wars.[5]  In those inflations, and in the last significant inflation in the UK, which followed the OPEC hikes in oil prices in the 1970s, the trade unions were strong enough to ensure that wages rose at around the rate of inflation. This is no longer the case.

Yet the recent inflation has given the Government unprecedented increases in tax, which means that, if they so choose, they can afford wage increases. Most of this extra income arises from not raising the ceilings on higher rates of tax. Jeremy Hunt would like to use it to lower rates of income tax. The IMF (no less!) has told him that it is not appropriate to do so at this time.[6] The main reason, not always clearly stated, is that there are many unfunded challenges, but of these the public sector pay disputes (and perhaps the need for additional spending on defence, where difficulties in retention and recruitment are also partly a matter of pay settlements not keeping up with inflation) are top of the list. 

Economists in the UK, the USA and other developed countries have had little to say in recent years about inflation. As if it is no longer a problem, which it probably isn’t if inflation stays at around 2%. But the present inflations, driven by wars, the climate crisis and the lockdowns, are another matter. Economic theory is little help. All the traditional theories have been shown to be false. It is not true that inflation and unemployment are opposites: we can have both together, so-called stagflation. Or that it can be controlled by limiting the supply of money, which is not possible when most of it is created by banks which lend far more than they hold in deposits. Or that it is either created by unexpected demands or by unexpected costs.

The British Government urgently needs to resolve the disputes about pay in the public sector, and to do so recognising that most local government employees are substantially worse off than they were before. The Labour spokesperson Angela Rayner has made the practical proposal of negotiating a three year settlement.[7]  It cannot come soon enough.


Andrew Coulson is a nationally-recognised expert on scrutiny in local government and is particularly interested in governance by committee.


[1] Local Government Association, https://www.local.gov.uk/about/campaigns/save-local-services/save-local-services-council-pressures-explained 2024

[2] https://www.countycouncilsnetwork.org.uk/councils-in-significantly-worse-financial-position-after-the-autumn-statement-with-seven-in-ten-now-unsure-if-they-can-balance-their-budget-next-year/

[3] A prescient academic law professor, writing as long ago as 1984, wrote “It seems to me that the provisions for rate-capping … are little removed from a proposal to replace elected councils by administrative units. For a very long time, local inhabitants have enjoyed the right to elect local representatives with the power to tax, and so to determine, within modest political limits, what level of services shall be provided in the locality. … I have no difficulty in saying of an Act to put a limit on the rates leviable by a local authority that it is politically unconstitutional”. John Griffiths, in the Preface to Half a Century of Municipal Decline 1935-1985, George Allen and Unwin, 1985, p.xii

[4] Thomas Piketty, Capital in the Twenty-First Century, Harvard University Press, 2014

[5] The point was also made by one of his critics, Joseph T Salano, “War and the Money Machine: Concealing the costs of War beneath the Veil of Inflation” in John V Denson (ed.) The Costs of War, Routledge, 2nd edn. 1999 

[6] David Milliken and William Schomberg,  https://www.reuters.com/world/uk/imf-cuts-uk-growth-outlook-2025-after-stronger-past-performance-2024-01-30/

[7] “Rayner floats three year pay deal”. Municipal Journal, 14 Feb. 2024